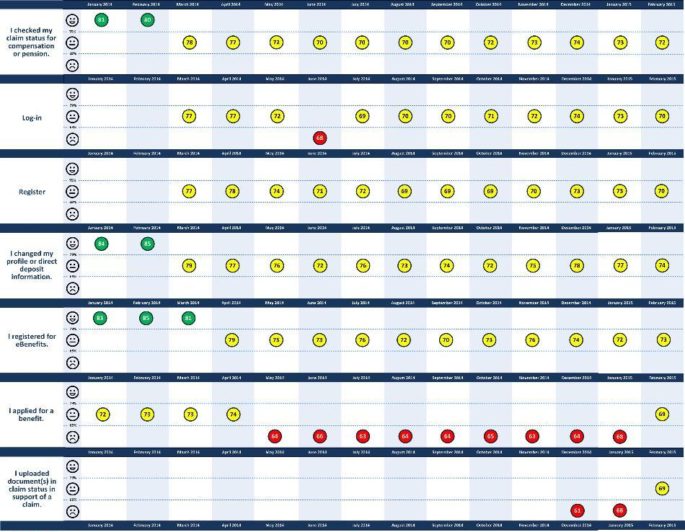
User satisfaction can be depicted in a series of infographics from a variety of survey data. This user satisfaction histogram is useful for tracking changes over a period of time. In this case, online survey results were compiled monthly.

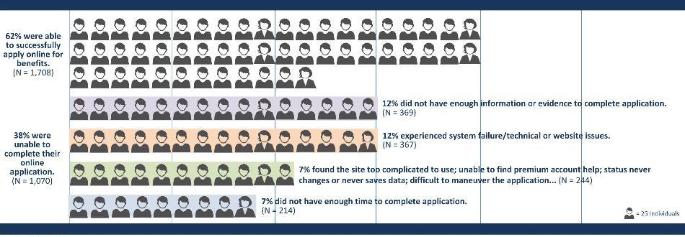
This infographic depicts the success or failure of users applying online for benefits. The unsuccessful attempts were further broken out by reason for the failed attempt. The goal of this infographic is to humanize statistics.

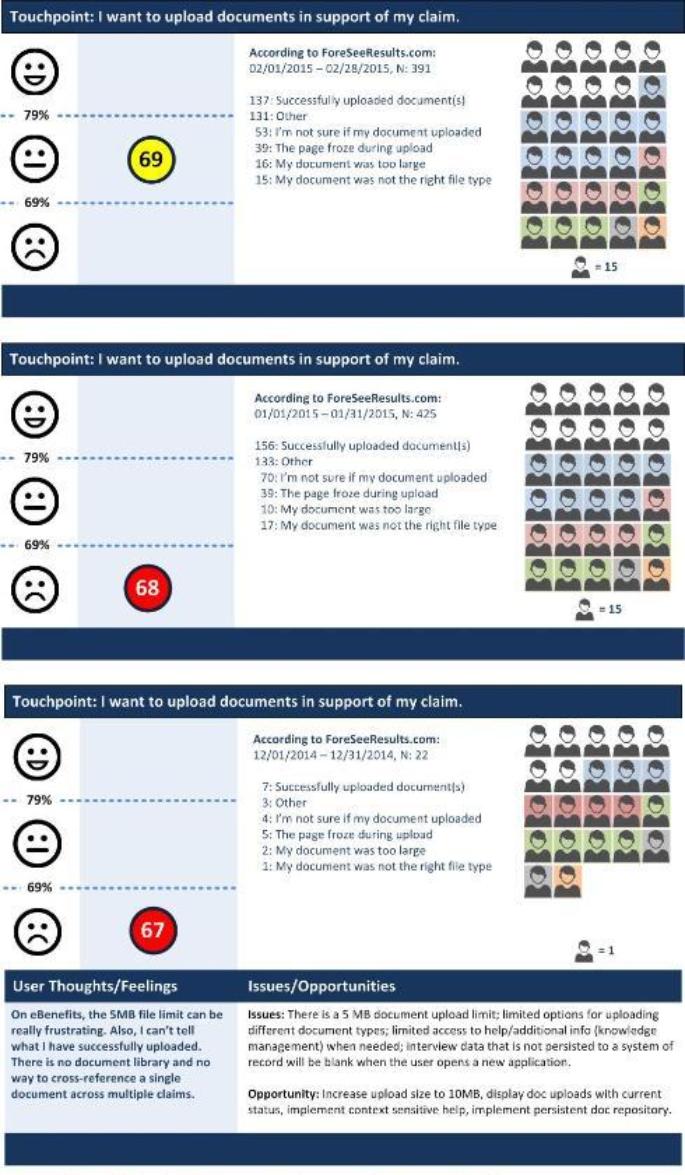
This infographic incorporates elements from the the previous two infographics to produce a satisfaction snapshot of a particular touchpoint over several months.